
 With the 7.2 release of the KACE Systems Management Appliance comes the welcome addition of widgets pertaining to the service desk within the appliance. Finally we have the ability to show Dashboard highlights on the front screen of our SMA's.
So just how much help has adding these widgets in been to those of us that are tasked with Ticket management for our organisations?
First, it is fair to say that there is a good selection of them available, 40 in total and they can broadly be split down into the following categories:
- Active Ticket Widgets
- Closed Ticket Widgets
- Overdue Ticket Widgets
- Due Ticket Widgets
- Reopened Ticket Widgets
- Average Ticket Resolution Widgets
As an initial look, we are getting a fairly broad spectrum of metrics and data, so let's break it down a little more...
Active tickets can be sorted by:
- Priority - Useful to if you have any high priority tickets outstanding
- Category - Helpful if you are monitoring a specific category
- Owner - Good to see who is holding all the work
- Queue - Great if you have multiple queues to manage
- Date Range - Helpful to spot if you have any really old calls
But which of my queues are these widgets reporting on, can you drill down to get more information when required and are you able change the scope of any of the metric graphs?
Closed Ticket widgets are a bit more of a mystery and they are very closely connected to Overdue and Due Ticket widgets, in that any closed ticket widget you may choose to use is further restricted by whether or not the ticket was due or overdue when it was closed. Clearly to make use of this function you will need to make sure that you have SLA's fully configured within your Service Desk Queue, if you can work out which queue the widgets are reporting from... But how, I wonder, do you get a simple widget that tells you how many calls you have closed in total today?
Reopened Ticket widgets are an interesting path to take, as I am sure most service desk managers know that a well managed desk should have a minimal number of reopened calls, as that tends to illustrate poor resolution or sometimes even poor customer communication. So to have so many options to view data, in an area that is not really of too much use...
Finally Average time to resolve ticket widgets are a great way to visually see what before was data only available from a report and I have to say being able to see the average time to resolve tickets by queue, can give a new level of insight, in particular if you have your technicians working in separate queues.
But overall, and here is really where the "rubber meets the road", these new widgets, just how useful are they in the real Service Desk world.
If you want to have an Admin console logged in all day, if you want your data displayed in a way that is undefinable and if you love the colour Blue, then it is just possible you may find something of use in this new functionality, but while there are still issue such as the screen refresh not updating widgets, so you have to do them individually and an inability to define exactly where in your KACE box the data is coming from, you may feel the need to continue your Quest.
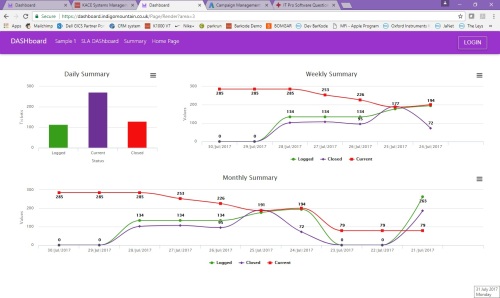
Indigo Mountain bringing colour, value, useful functionality to your sysadmin life and helping you to drive more value out of your KACE Service desk.
Click here to check out our latest DASHboard release.

Comments